Virtually every business in the world collects data on a daily basis. For some, data collection is their entire function. For others, management might not even realize that they are collecting data. Regardless of the scope of data collection a business does on a day to day basis you find a simple truth:
Data means nothing if you don't have the tools to visualize it.
What exactly is "data"?
When the word "data" gets thrown around, people tend to imagine different things. Often, one of the first images that come to mind is some abstract computational information - a collection of ones and zeros. While that is certainly a form of data and you wouldn't be wrong in picturing it, it isn't exactly what we mean.
Data is broader than that. Ultimately, data is information. Any and every type of information, once collected and stored, is data. Let's say you are a business that needs to collect customer information. As soon as you store that information on the computer or in the cloud, it becomes data.
What do you do with data?
So you've collected the information and stored it, turning it into data in the process. Now what? You need to make it worth something. Data alone does you no good. Sure, it might be useful in recalling certain information about a single instance. Let's go back to the earlier example. You've just taken down a customer's information. Based on that single piece of data, you can find their phone number and email, maybe some of their preferences, their address, and any other information you took down.
So what?
How does that piece of data actually help your business? You need to think about the bigger picture. Sure, that's just the data of one customer. But maybe you have 1,000 customers. That is 1,000 pieces of individual data, just waiting to be analyzed and reported. You have all their information, so you can analyze the data and actually learn something about your customers' demographics. This information is endlessly valuable and it enables you to make decisions for your business that really matter.
Don't just collect data. Visualize it.
Data is useless if you don't have the tools to make your data work for you. Sure, you could use something like Excel and lay out all your data in a spreadsheet. But that is going to take hours to input and organize, and even the most advanced Excel users are limited by the platforms ability to display that data in an easy to understand way. You need to be able to see the data effectively. You need a program that enables you to see all your data laid out in a virtual dashboard, and ideally, one that updates in real-time to report data insights as they are happening. You need a tool like Array.
Visualize your data with Array.
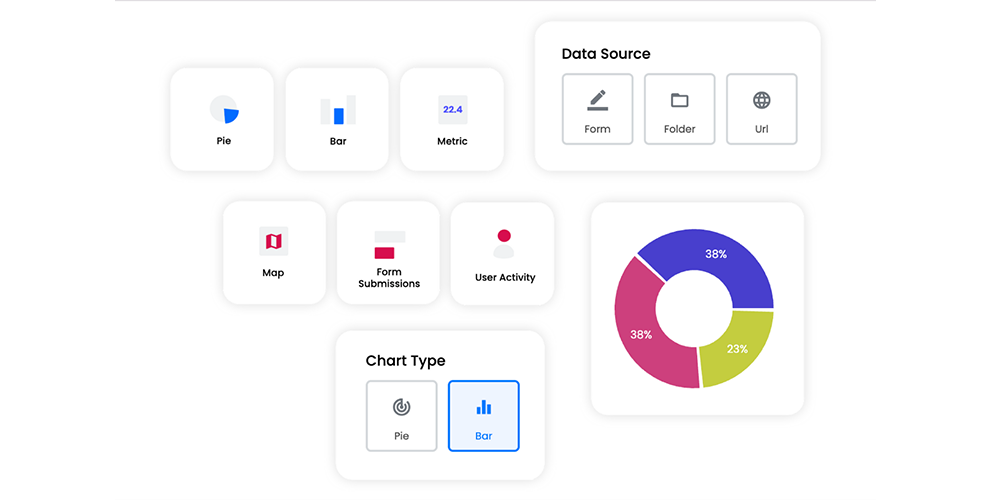
Array doesn't just assist in data collection with its powerful forms. It also keeps your data safe and accessible in a fully secure encrypted cloud-based storage system. Then, you can use the reports dashboard to see your data laid out in a visual way. Sort your data by individual metrics, or see it all at once. Whether you want graphs, charts, maps, or any other visual format, Array makes it easy to see your data in a digestible way. The best part? It updates in real time with every new form submission so you are always fully informed.
Are you ready to change the way you engage with your data? Book a demo and see how Array can help.


