

Last month, we explained the thoughts that went into re-designing the UI of the Array app and dashboard, to make it easier, faster and more intuitive to get the information you need.
But we didn’t just enhance the look and feel to make Array easier to use. We also added the functionality that our users have asked for. Because while Array started small, we’re always thinking big. And that means constant improvements to help your operations run more smoothly.
So if you’re about to try Array for the first time, or you’re an existing customer logging into the upgraded dashboard, here’s what you can expect:
It’s Easier Than Ever to Take Notes
One of Array’s key functions is being able to request images from users as part of self-managed inspections or site visits.
So we’ve made it easier than ever to make notes. Use the built-in tools to focus attention on specific details on the images that Array captures for you with a new draw and highlight function.
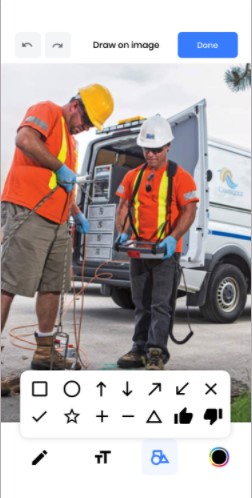
Add text, draw freehand, or add in specific icons to instantly turn photographs into valuable, instructive data.
Streamline Your Workflows
Smart Array users already use our intuitive form builder to create workflows, and we’ve made a small change to improve usability and streamline the whole process.
By allowing forms to be built as sections, longer, more complex workflows can now be split into multiple sections. This means forms no longer have to be completed in a single sitting, reducing user drop-off and increasing productivity.
Different sections can even be assigned to different departments, allowing for simple, effective collaboration.
With Array you can now produce custom documents quickly and easily, edit specific sections, and track the progress of your workflows.
Track Your Physical Assets
While Array’s always helped collate your digital data, it can now track physical assets and hardgoods too.
As a new employee joins your organization and you issue them with a tablet, phone or laptop, you can track who has what, where, and why. Array tracks IMEI, colors, prices and locations, with check-in and check-out of items to ensure that you always know where a specific asset is at any given time.
Coming Soon - Custom Reporting
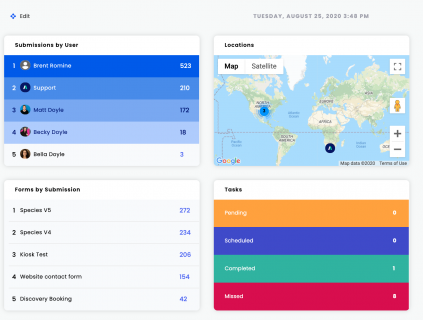
We’re constantly looking for ways to improve our tools, and next in the pipeline is a custom reporting dashboard.
This function will pull data from Array and your chosen external sources to cover the metrics, charts and filter options of your choice.
Including:
- Maps
- Media feeds
- Heat maps
- Pie charts
- Bar graphs
- Line graphs
- Plotted KPIs
The custom dashboard will be configured to meet your exact needs, on demand, by our experts. We’ll speak to you directly to discover exactly what you need, and plot out a list of sources we’ll need to track, including Array forms, external APIs and webhooks.
We’ll then use a template to create custom reporting tiles and filters, and add an icon to your admin panel.
You’ll be able to control access levels across your organization, leading to simpler, more secure data analysis and reporting.
The monthly cost of these custom dashboards will start at $300 per month, with one-off set-up fees from $5,000. But the benefits it can bring to your business will be priceless!
See How Our Powerful New Features Make Everything Simpler - Try Array Today
If this is your first visit to the Array blog, and you don’t use our simple, effective data-collecting platform, you might wonder what our powerful tool can do for you.
We’d love to show you. You can arrange a chat with our team, or you can see Array in action for yourself by taking advantage of our free trial. You won’t even need your credit card.